ER Diagrams
Design database schemas with entities and relationships. Ideal for database modeling and documentation.
What is ER Diagrams?
Entity-Relationship (ER) diagrams are database modeling tools that show the logical structure of databases. They illustrate entities (tables), their attributes (columns), and relationships between them (foreign keys). ER diagrams help database designers plan schema structure, identify data dependencies, and communicate database architecture to developers and stakeholders.
Edit and preview
Build a ER Diagrams with Mermaid syntax and see changes instantly.
Example
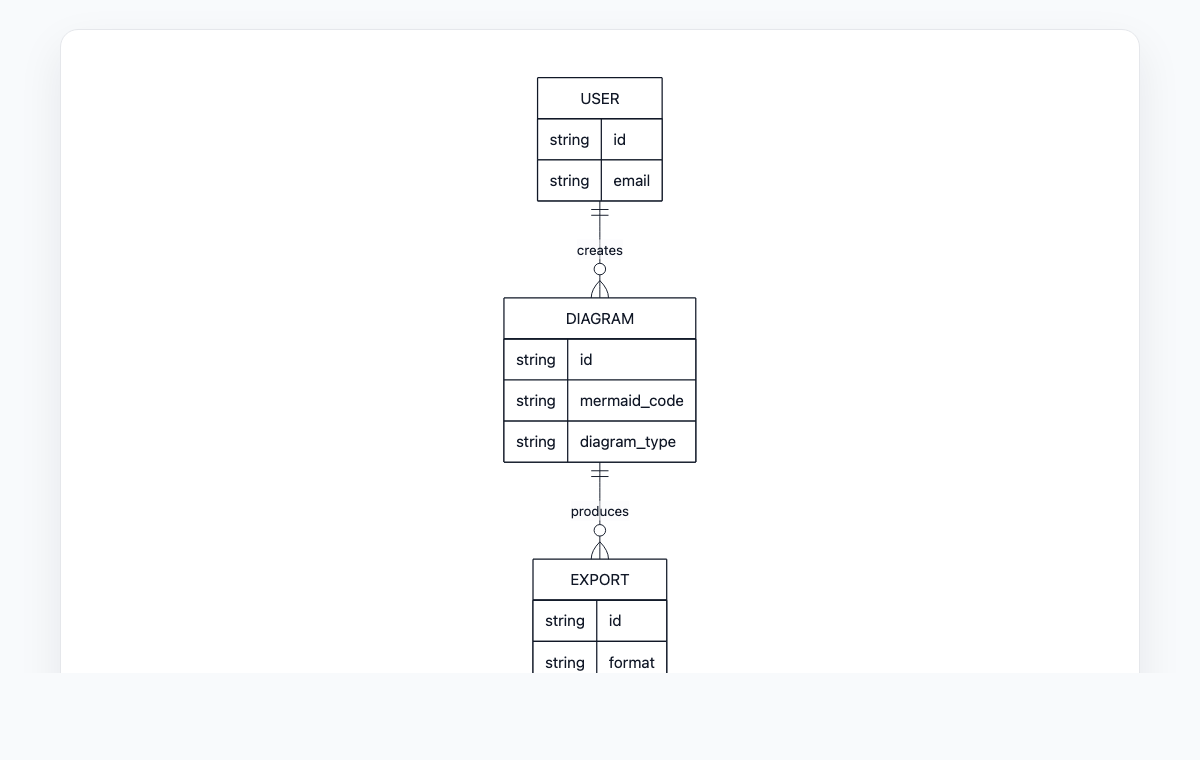
ER diagram example
A Mermaid ER diagram for users, diagrams, and generated exports.
Mermaid code
erDiagram
    USER ||--o{ DIAGRAM : creates
    DIAGRAM ||--o{ EXPORT : produces
    USER {
      string id
      string email
    }
    DIAGRAM {
      string id
      string mermaid_code
      string diagram_type
    }
    EXPORT {
      string id
      string format
    }
Common Use Cases
Database Schema Design
Plan relational database structures before implementation. Design tables, columns, data types, and constraints for new applications.
ORM Model Planning
Visualize object models for ORMs like Prisma, TypeORM, or SQLAlchemy. Map entities to database tables and define relationships.
Data Migration
Document existing database structures before migration. Identify data relationships and dependencies for ETL processes.
Database Documentation
Create visual documentation of database schemas. Help developers understand data models and table relationships.
Key Features
Entity Definition
Define entities (tables) with attributes, primary keys, and data types using standard ER notation.
Relationship Types
Model one-to-one, one-to-many, and many-to-many relationships with proper cardinality notation.
Attribute Properties
Specify attribute constraints like NOT NULL, UNIQUE, DEFAULT values, and foreign key references.
Crow's Foot Notation
Use industry-standard crow's foot notation for clear relationship visualization and cardinality.
Best Practices
Normalize Appropriately
Apply normalization principles to reduce redundancy. Usually aim for 3rd normal form, but know when to denormalize.
Name Consistently
Use clear, consistent naming conventions for entities and attributes. Follow team or industry standards.
Document Relationships
Clearly specify relationship cardinality. Use descriptive relationship names when helpful.
Start with Core Entities
Identify main business entities first, then add supporting and junction tables as needed.
Explore other diagram types
Flowcharts
Visualize processes, workflows, and algorithms with nodes and directional arrows. Perfect for business processes and decision trees.
Sequence Diagrams
Document interactions between different actors or systems over time. Ideal for API documentation and system design.
Class Diagrams
Model object-oriented systems with classes, attributes, and relationships. Essential for software architecture planning.
State Diagrams
Represent state transitions in systems or applications. Great for modeling lifecycle states and workflows.
Gantt Charts
Plan and track project timelines with tasks and dependencies. Perfect for project management and scheduling.
User Journey
Map user experiences and interactions across touchpoints. Excellent for UX design and customer journey mapping.
Git Graphs
Visualize Git branching strategies and commit histories. Helpful for explaining version control workflows.
Mindmaps
Organize ideas, brainstorm concepts, and create hierarchical visual structures. Perfect for planning and knowledge mapping.
Pie Charts
Display proportional data distributions with circular charts. Ideal for showing percentages and market share breakdowns.
Timelines
Visualize chronological events and milestones along a time axis. Great for project histories and roadmaps.
Kanban Boards
Organize tasks into columns representing workflow stages. Perfect for agile project management and task tracking.
Quadrant Charts
Plot items on a two-axis grid to compare and prioritize. Ideal for feature prioritization and strategic analysis.
Sankey Diagrams
Visualize flow quantities between nodes with proportional arrows. Perfect for energy flows, budget allocation, and conversion funnels.
XY Charts
Create bar charts and line charts with customizable axes. Ideal for data visualization and trend analysis.
Block Diagrams
Build structured layouts with blocks arranged in columns and rows. Great for system architecture and component overviews.
Architecture Diagrams
Design cloud and system architecture with service icons and connections. Perfect for infrastructure documentation.
Packet Diagrams
Visualize network protocol packet structures with bit-level field layouts. Essential for network protocol documentation.