Sequence Diagrams
Document interactions between different actors or systems over time. Ideal for API documentation and system design.
What is Sequence Diagrams?
Sequence diagrams are UML interaction diagrams that show how objects or systems communicate with each other over time. They display the chronological order of message exchanges between different actors, making them invaluable for documenting API flows, system interactions, and multi-step processes. Each participant is represented by a vertical lifeline, with horizontal arrows showing message exchanges.
Edit and preview
Build a Sequence Diagrams with Mermaid syntax and see changes instantly.
Example
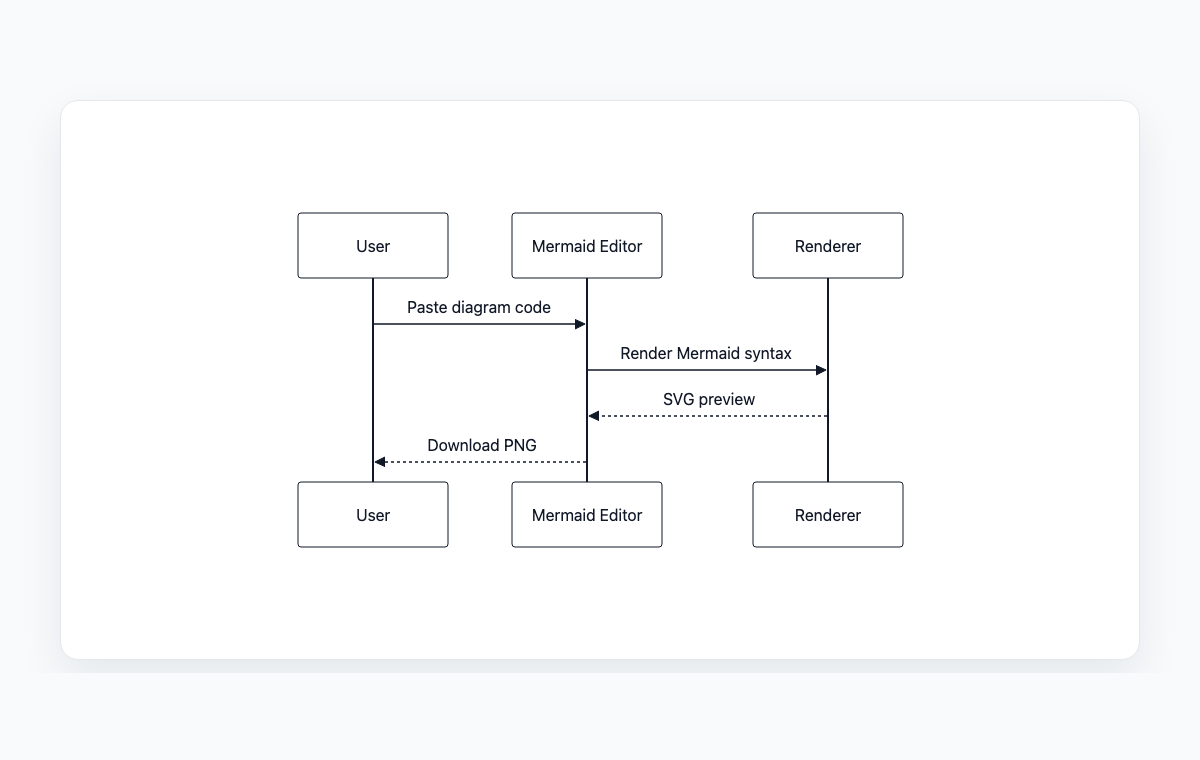
Sequence diagram example
A Mermaid sequence diagram for documenting browser, editor, and renderer interactions.
Mermaid code
sequenceDiagram
    participant User
    participant WebApp as Mermaid Editor
    participant Renderer
    User->>WebApp: Paste diagram code
    WebApp->>Renderer: Render Mermaid syntax
    Renderer-->>WebApp: SVG preview
    WebApp-->>User: Download PNG
Common Use Cases
API Documentation
Document API endpoints and their interaction flows. Visualize request-response cycles, authentication flows, error handling, and data exchanges between client and server.
Microservices Architecture
Map communication patterns between microservices, message queues, and databases. Essential for understanding distributed system behavior and debugging integration issues.
Authentication & Authorization
Model multi-step authentication processes like OAuth, SAML, or JWT token flows. Show the sequence of redirects, token exchanges, and validation steps.
System Integration
Visualize how different systems interact in complex integration scenarios. Document webhook callbacks, event-driven architectures, and third-party service integrations.
Key Features
Participant Management
Define multiple actors, systems, or services with aliases and activation boxes to show when components are actively processing.
Message Types
Support for synchronous calls, asynchronous messages, return values, and self-calls with different arrow styles for clarity.
Control Structures
Model loops, conditional branches (alt/else), optional blocks, and parallel processing with intuitive syntax.
Notes & Annotations
Add explanatory notes to any point in the sequence to provide context, clarify business logic, or document edge cases.
Best Practices
Focus on One Scenario
Each sequence diagram should represent a single use case or interaction flow. Create separate diagrams for different scenarios rather than combining everything.
Use Meaningful Names
Give participants clear, descriptive names. Use actual service names or role titles rather than generic labels like 'System A' or 'Component 1'.
Show Error Paths
Don't just document the happy path. Include alternative flows for error conditions, timeouts, and exception handling.
Keep Time Top-to-Bottom
Follow the convention that time flows from top to bottom. Earlier interactions should appear higher in the diagram than later ones.
Explore other diagram types
Flowcharts
Visualize processes, workflows, and algorithms with nodes and directional arrows. Perfect for business processes and decision trees.
Class Diagrams
Model object-oriented systems with classes, attributes, and relationships. Essential for software architecture planning.
State Diagrams
Represent state transitions in systems or applications. Great for modeling lifecycle states and workflows.
Gantt Charts
Plan and track project timelines with tasks and dependencies. Perfect for project management and scheduling.
ER Diagrams
Design database schemas with entities and relationships. Ideal for database modeling and documentation.
User Journey
Map user experiences and interactions across touchpoints. Excellent for UX design and customer journey mapping.
Git Graphs
Visualize Git branching strategies and commit histories. Helpful for explaining version control workflows.
Mindmaps
Organize ideas, brainstorm concepts, and create hierarchical visual structures. Perfect for planning and knowledge mapping.
Pie Charts
Display proportional data distributions with circular charts. Ideal for showing percentages and market share breakdowns.
Timelines
Visualize chronological events and milestones along a time axis. Great for project histories and roadmaps.
Kanban Boards
Organize tasks into columns representing workflow stages. Perfect for agile project management and task tracking.
Quadrant Charts
Plot items on a two-axis grid to compare and prioritize. Ideal for feature prioritization and strategic analysis.
Sankey Diagrams
Visualize flow quantities between nodes with proportional arrows. Perfect for energy flows, budget allocation, and conversion funnels.
XY Charts
Create bar charts and line charts with customizable axes. Ideal for data visualization and trend analysis.
Block Diagrams
Build structured layouts with blocks arranged in columns and rows. Great for system architecture and component overviews.
Architecture Diagrams
Design cloud and system architecture with service icons and connections. Perfect for infrastructure documentation.
Packet Diagrams
Visualize network protocol packet structures with bit-level field layouts. Essential for network protocol documentation.