User Journey
Map user experiences and interactions across touchpoints. Excellent for UX design and customer journey mapping.
What is User Journey?
User journey diagrams map the complete experience a user has when interacting with a product or service across multiple touchpoints. They visualize actions, emotions, pain points, and opportunities at each stage of the customer journey. These diagrams are essential for UX design, helping teams build empathy and identify areas for improvement in the user experience.
Edit and preview
Build a User Journey with Mermaid syntax and see changes instantly.
Example
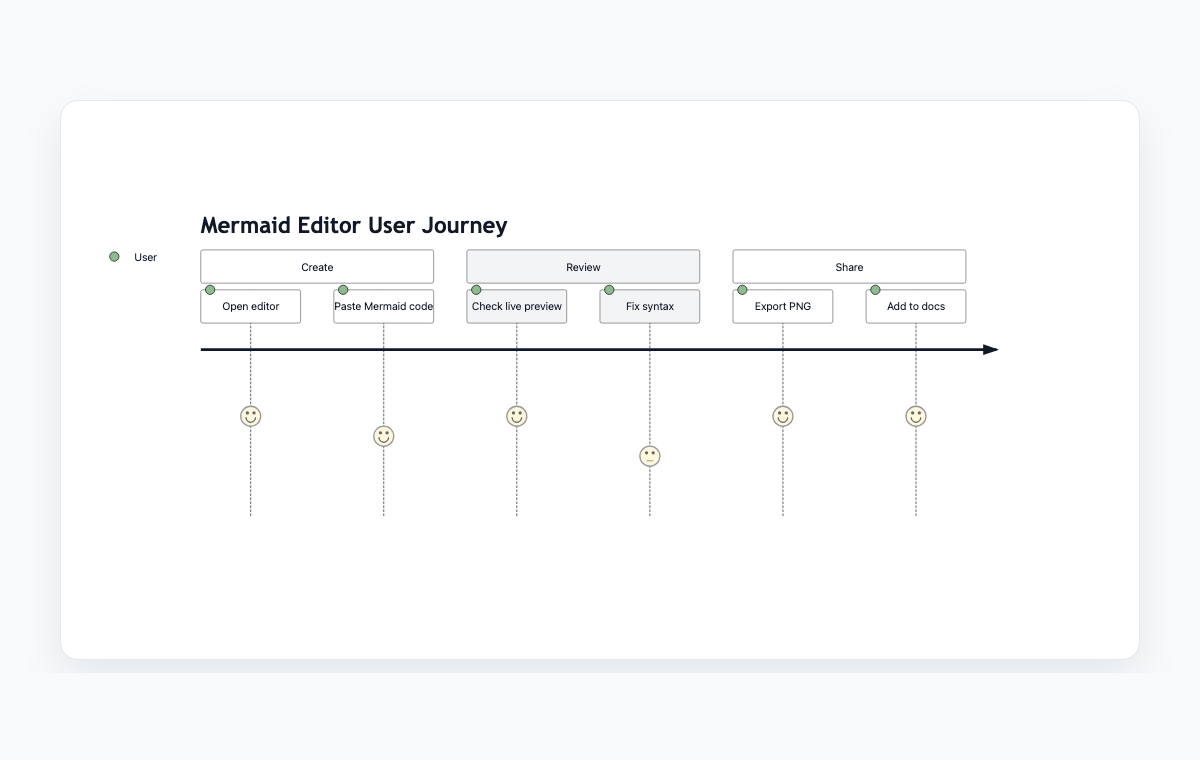
User journey example
A Mermaid journey map covering diagram creation, preview, and sharing.
Mermaid code
journey
    title Mermaid Editor User Journey
    section Create
      Open editor: 5: User
      Paste Mermaid code: 4: User
    section Review
      Check live preview: 5: User
      Fix syntax: 3: User
    section Share
      Export PNG: 5: User
      Add to docs: 5: User
Common Use Cases
UX Research
Document findings from user interviews and usability testing. Visualize user behavior patterns and emotional responses across the product journey.
Customer Experience Design
Map omnichannel customer experiences across web, mobile, email, and physical touchpoints. Identify consistency issues and opportunities.
Product Development
Guide feature prioritization by identifying high-impact pain points. Build user-centered products by understanding user needs at each stage.
Service Design
Visualize end-to-end service experiences. Map customer touchpoints, employee interactions, and backend processes.
Key Features
Journey Phases
Break the journey into logical phases like awareness, consideration, purchase, usage, and advocacy.
User Actions
Document what users do at each stage. Capture clicks, searches, conversations, and physical actions.
Emotional Scores
Rate user satisfaction or frustration at each touchpoint. Visualize emotional highs and lows throughout the journey.
Multi-Actor Support
Show journeys from different user perspectives or roles interacting with the same system.
Best Practices
Base on Research
Ground journey maps in real user research, not assumptions. Use interviews, analytics, and observations.
Focus on One Persona
Create separate journey maps for different user segments. Each persona has different needs and behaviors.
Identify Pain Points
Highlight moments of friction and frustration. These are your biggest opportunities for improvement.
Make It Actionable
Don't just document—identify specific opportunities and assign ownership for improvements.
Explore other diagram types
Flowcharts
Visualize processes, workflows, and algorithms with nodes and directional arrows. Perfect for business processes and decision trees.
Sequence Diagrams
Document interactions between different actors or systems over time. Ideal for API documentation and system design.
Class Diagrams
Model object-oriented systems with classes, attributes, and relationships. Essential for software architecture planning.
State Diagrams
Represent state transitions in systems or applications. Great for modeling lifecycle states and workflows.
Gantt Charts
Plan and track project timelines with tasks and dependencies. Perfect for project management and scheduling.
ER Diagrams
Design database schemas with entities and relationships. Ideal for database modeling and documentation.
Git Graphs
Visualize Git branching strategies and commit histories. Helpful for explaining version control workflows.
Mindmaps
Organize ideas, brainstorm concepts, and create hierarchical visual structures. Perfect for planning and knowledge mapping.
Pie Charts
Display proportional data distributions with circular charts. Ideal for showing percentages and market share breakdowns.
Timelines
Visualize chronological events and milestones along a time axis. Great for project histories and roadmaps.
Kanban Boards
Organize tasks into columns representing workflow stages. Perfect for agile project management and task tracking.
Quadrant Charts
Plot items on a two-axis grid to compare and prioritize. Ideal for feature prioritization and strategic analysis.
Sankey Diagrams
Visualize flow quantities between nodes with proportional arrows. Perfect for energy flows, budget allocation, and conversion funnels.
XY Charts
Create bar charts and line charts with customizable axes. Ideal for data visualization and trend analysis.
Block Diagrams
Build structured layouts with blocks arranged in columns and rows. Great for system architecture and component overviews.
Architecture Diagrams
Design cloud and system architecture with service icons and connections. Perfect for infrastructure documentation.
Packet Diagrams
Visualize network protocol packet structures with bit-level field layouts. Essential for network protocol documentation.