State Diagrams
Represent state transitions in systems or applications. Great for modeling lifecycle states and workflows.
What is State Diagrams?
State diagrams, also known as state machine diagrams, visualize the different states an object or system can be in and how it transitions between states in response to events. They are essential for modeling lifecycle behavior, workflows, and complex conditional logic. Each state represents a stable condition, while transitions show triggers that cause state changes.
Edit and preview
Build a State Diagrams with Mermaid syntax and see changes instantly.
Example
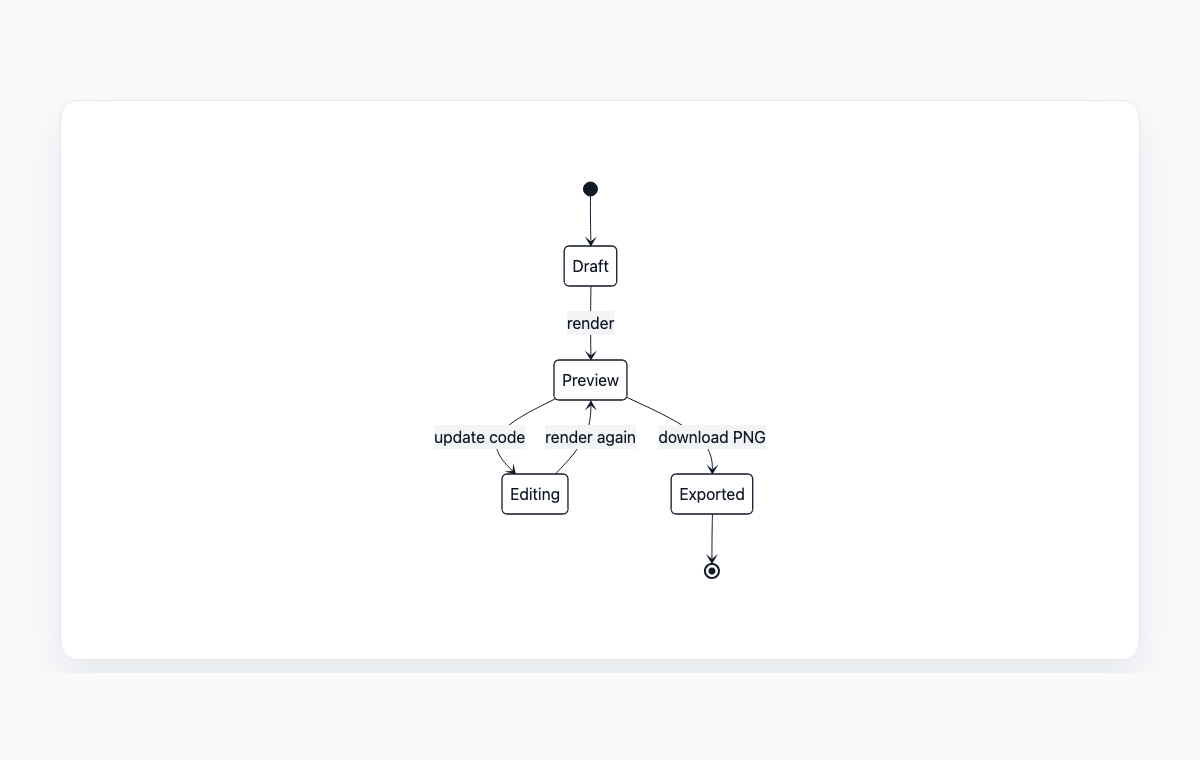
State diagram example
A Mermaid state diagram for a diagram moving from draft to preview, edit, and export.
Mermaid code
stateDiagram-v2
    [*] --> Draft
    Draft --> Preview: render
    Preview --> Editing: update code
    Preview --> Exported: download PNG
    Editing --> Preview: render again
    Exported --> [*]
Common Use Cases
Application State Management
Model UI states, form validation flows, and application modes. Essential for designing state machines in frontend frameworks like React or Vue.
Workflow Modeling
Design approval workflows, order processing states, and ticket lifecycle management. Map status transitions and guard conditions for business processes.
Protocol Design
Visualize network protocol states, connection lifecycles, and communication state machines. Crucial for embedded systems and IoT device programming.
Game Development
Model character states, game modes, and level progression. Design finite state machines for AI behavior and game mechanics.
Key Features
State Types
Support for simple states, composite states, and special states like initial, final, and choice pseudostates.
Transition Guards
Define conditional transitions with guard conditions and actions that execute during state changes.
Nested States
Create hierarchical state machines with parent and child states for modeling complex behavior.
Concurrent States
Model parallel state machines and orthogonal regions for systems with concurrent behavior.
Best Practices
Start Simple
Begin with high-level states and gradually refine. Use composite states to hide complexity until needed.
Name States as Conditions
Use adjectives or past participles (e.g., 'Active', 'Suspended', 'Completed') rather than verbs.
Document Transitions
Label all transitions with events, guard conditions, and actions. Every arrow should tell a clear story.
Avoid State Explosion
If you have too many states, look for patterns to combine them or use state variables instead.
Explore other diagram types
Flowcharts
Visualize processes, workflows, and algorithms with nodes and directional arrows. Perfect for business processes and decision trees.
Sequence Diagrams
Document interactions between different actors or systems over time. Ideal for API documentation and system design.
Class Diagrams
Model object-oriented systems with classes, attributes, and relationships. Essential for software architecture planning.
Gantt Charts
Plan and track project timelines with tasks and dependencies. Perfect for project management and scheduling.
ER Diagrams
Design database schemas with entities and relationships. Ideal for database modeling and documentation.
User Journey
Map user experiences and interactions across touchpoints. Excellent for UX design and customer journey mapping.
Git Graphs
Visualize Git branching strategies and commit histories. Helpful for explaining version control workflows.
Mindmaps
Organize ideas, brainstorm concepts, and create hierarchical visual structures. Perfect for planning and knowledge mapping.
Pie Charts
Display proportional data distributions with circular charts. Ideal for showing percentages and market share breakdowns.
Timelines
Visualize chronological events and milestones along a time axis. Great for project histories and roadmaps.
Kanban Boards
Organize tasks into columns representing workflow stages. Perfect for agile project management and task tracking.
Quadrant Charts
Plot items on a two-axis grid to compare and prioritize. Ideal for feature prioritization and strategic analysis.
Sankey Diagrams
Visualize flow quantities between nodes with proportional arrows. Perfect for energy flows, budget allocation, and conversion funnels.
XY Charts
Create bar charts and line charts with customizable axes. Ideal for data visualization and trend analysis.
Block Diagrams
Build structured layouts with blocks arranged in columns and rows. Great for system architecture and component overviews.
Architecture Diagrams
Design cloud and system architecture with service icons and connections. Perfect for infrastructure documentation.
Packet Diagrams
Visualize network protocol packet structures with bit-level field layouts. Essential for network protocol documentation.