Class Diagrams
Model object-oriented systems with classes, attributes, and relationships. Essential for software architecture planning.
What is Class Diagrams?
Class diagrams are UML structural diagrams that model the static structure of object-oriented systems. They show classes, their attributes, methods, and the relationships between them (inheritance, association, composition, aggregation). Class diagrams serve as blueprints for software architecture, helping developers visualize system design before writing code.
Edit and preview
Build a Class Diagrams with Mermaid syntax and see changes instantly.
Example
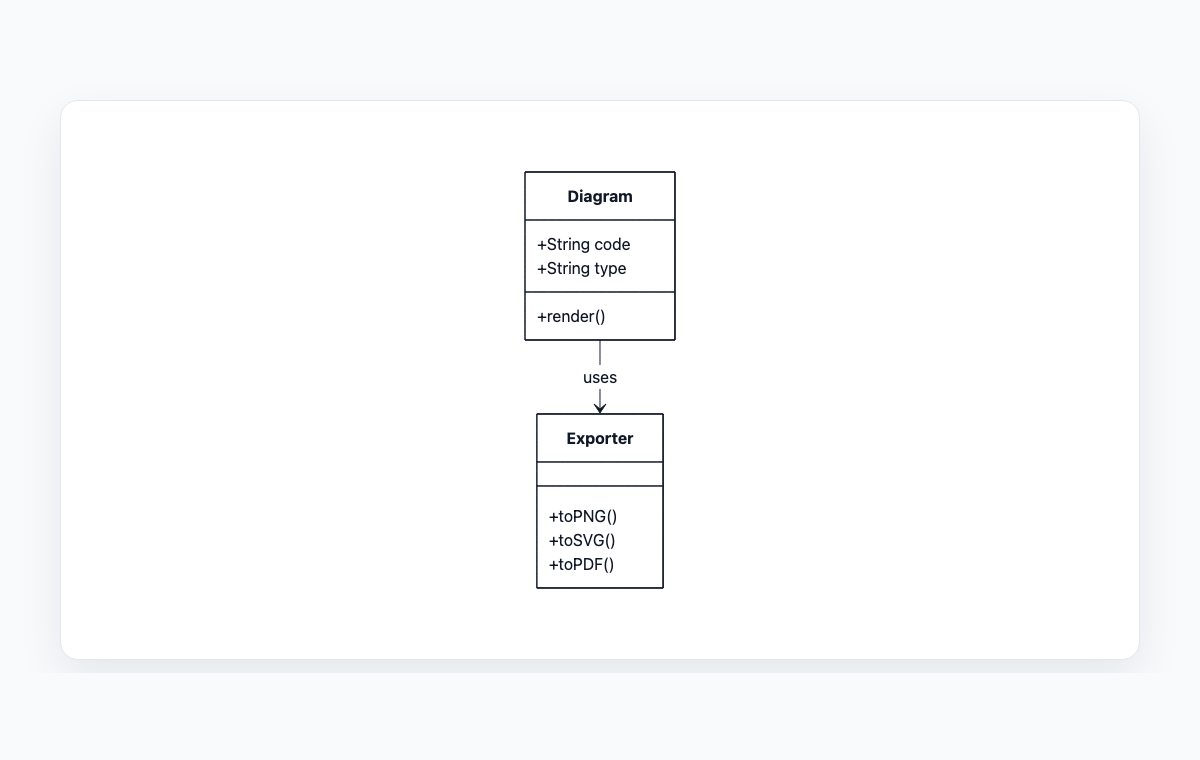
Class diagram example
A compact UML class diagram showing a diagram model connected to export methods.
Mermaid code
classDiagram
    class Diagram {
      +String code
      +String type
      +render()
    }
    class Exporter {
      +toPNG()
      +toSVG()
      +toPDF()
    }
    Diagram --> Exporter : uses
Common Use Cases
Software Architecture Planning
Design the structure of applications before implementation. Define classes, their responsibilities, and how they interact to build maintainable, scalable systems.
Object-Oriented Design
Model inheritance hierarchies, interfaces, and abstract classes. Visualize polymorphism, encapsulation, and design patterns like Factory, Singleton, or Observer.
Code Documentation
Generate visual documentation of existing code structure. Help new team members understand complex class hierarchies and dependencies quickly.
Database Schema Planning
Map object models to database tables. Identify entities, relationships, and cardinality before implementing ORM models or database schemas.
Key Features
Class Structure Definition
Define class names, attributes with visibility modifiers (public, private, protected), and methods with return types and parameters.
Relationship Types
Model inheritance (generalization), association, aggregation, composition, and dependency relationships with proper UML notation.
Interfaces & Abstract Classes
Distinguish between concrete classes, abstract classes, and interfaces using standard UML conventions and stereotypes.
Multiplicity & Constraints
Specify relationship cardinality (1..1, 1..*, 0..*) and add constraints or notes to clarify business rules and design decisions.
Best Practices
Start with Core Classes
Begin with the most important domain entities and gradually add supporting classes. Don't try to model everything at once.
Use Proper Visibility
Mark attributes and methods with appropriate visibility: + for public, - for private, # for protected. This documents encapsulation decisions.
Show Relevant Relationships
Include only meaningful relationships. Not every class interaction needs to be shown—focus on architectural significance.
Keep Diagrams Focused
Create multiple smaller diagrams for different subsystems rather than one massive diagram. Each should tell a clear story.
Explore other diagram types
Flowcharts
Visualize processes, workflows, and algorithms with nodes and directional arrows. Perfect for business processes and decision trees.
Sequence Diagrams
Document interactions between different actors or systems over time. Ideal for API documentation and system design.
State Diagrams
Represent state transitions in systems or applications. Great for modeling lifecycle states and workflows.
Gantt Charts
Plan and track project timelines with tasks and dependencies. Perfect for project management and scheduling.
ER Diagrams
Design database schemas with entities and relationships. Ideal for database modeling and documentation.
User Journey
Map user experiences and interactions across touchpoints. Excellent for UX design and customer journey mapping.
Git Graphs
Visualize Git branching strategies and commit histories. Helpful for explaining version control workflows.
Mindmaps
Organize ideas, brainstorm concepts, and create hierarchical visual structures. Perfect for planning and knowledge mapping.
Pie Charts
Display proportional data distributions with circular charts. Ideal for showing percentages and market share breakdowns.
Timelines
Visualize chronological events and milestones along a time axis. Great for project histories and roadmaps.
Kanban Boards
Organize tasks into columns representing workflow stages. Perfect for agile project management and task tracking.
Quadrant Charts
Plot items on a two-axis grid to compare and prioritize. Ideal for feature prioritization and strategic analysis.
Sankey Diagrams
Visualize flow quantities between nodes with proportional arrows. Perfect for energy flows, budget allocation, and conversion funnels.
XY Charts
Create bar charts and line charts with customizable axes. Ideal for data visualization and trend analysis.
Block Diagrams
Build structured layouts with blocks arranged in columns and rows. Great for system architecture and component overviews.
Architecture Diagrams
Design cloud and system architecture with service icons and connections. Perfect for infrastructure documentation.
Packet Diagrams
Visualize network protocol packet structures with bit-level field layouts. Essential for network protocol documentation.