Gantt Charts
Plan and track project timelines with tasks and dependencies. Perfect for project management and scheduling.
What is Gantt Charts?
Gantt charts are project management tools that display tasks along a timeline, showing start dates, durations, dependencies, and progress. Named after Henry Gantt, they provide a visual overview of project schedules, making it easy to track milestones, identify critical paths, and coordinate team resources. Each horizontal bar represents a task, with its length indicating duration.
Edit and preview
Build a Gantt Charts with Mermaid syntax and see changes instantly.
Example
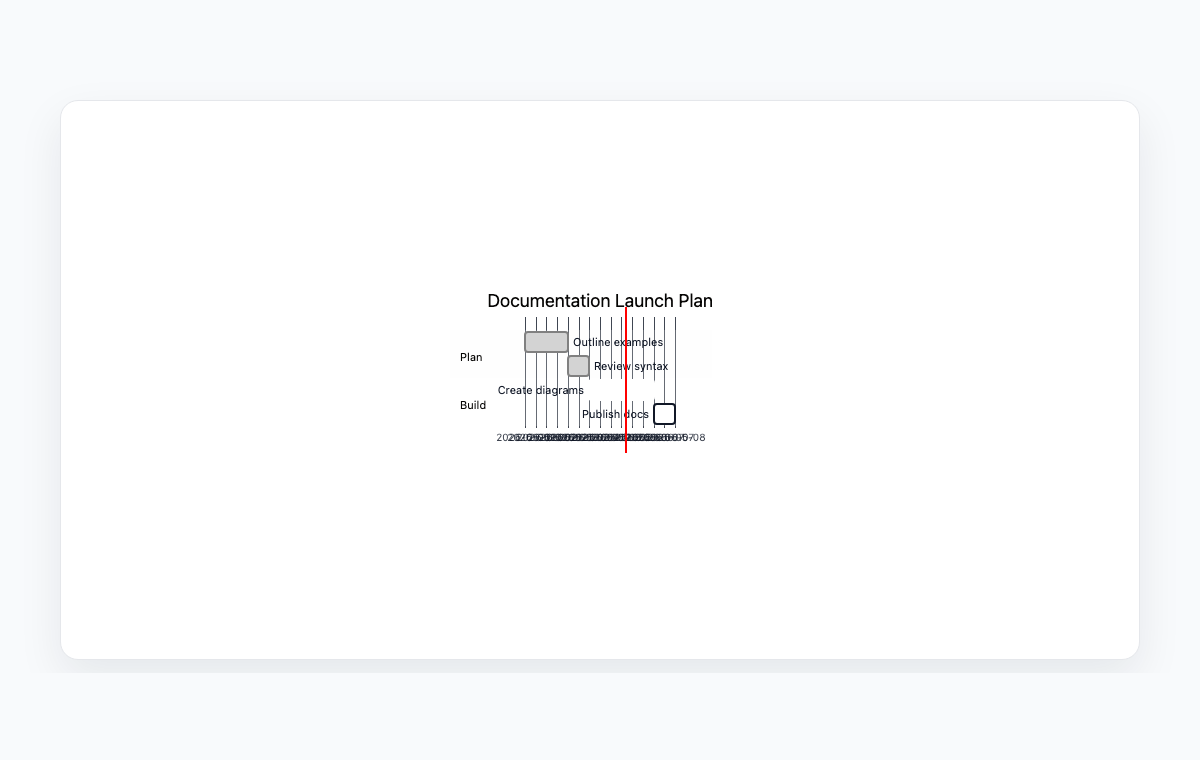
Gantt chart example
A Mermaid Gantt chart for planning documentation work with dependent tasks.
Mermaid code
gantt
    title Documentation Launch Plan
    dateFormat  YYYY-MM-DD
    section Plan
    Outline examples      :done, p1, 2026-05-01, 2d
    Review syntax         :done, p2, after p1, 1d
    section Build
    Create diagrams       :active, b1, 2026-05-04, 3d
    Publish docs          :b2, after b1, 1d
Common Use Cases
Project Planning
Plan software releases, construction projects, or marketing campaigns. Break down large projects into manageable tasks with clear timelines.
Resource Management
Visualize team workload and identify resource conflicts. Ensure balanced task distribution across team members and time periods.
Milestone Tracking
Mark key deliverables and deadlines. Communicate project phases to stakeholders and monitor progress toward goals.
Dependency Management
Show task dependencies and critical path. Identify which tasks must be completed before others can start.
Key Features
Task Hierarchy
Organize tasks into sections and subsections. Create work breakdown structures with parent and child tasks.
Date Ranges
Set start and end dates for each task. Visualize task duration and overlap on the timeline.
Task Dependencies
Link tasks with finish-to-start, start-to-start, or other dependency relationships.
Progress Tracking
Mark tasks as complete or in-progress. Visualize overall project completion percentage.
Best Practices
Break Down Work
Decompose large tasks into smaller, measurable units. Aim for tasks that take days, not months.
Identify Dependencies Early
Map out task relationships before assigning dates. This reveals the critical path and potential bottlenecks.
Update Regularly
Keep the Gantt chart current by updating task status and dates. An outdated chart loses its value quickly.
Don't Over-Detail
Focus on significant tasks and milestones. Too much detail makes charts unreadable and hard to maintain.
Explore other diagram types
Flowcharts
Visualize processes, workflows, and algorithms with nodes and directional arrows. Perfect for business processes and decision trees.
Sequence Diagrams
Document interactions between different actors or systems over time. Ideal for API documentation and system design.
Class Diagrams
Model object-oriented systems with classes, attributes, and relationships. Essential for software architecture planning.
State Diagrams
Represent state transitions in systems or applications. Great for modeling lifecycle states and workflows.
ER Diagrams
Design database schemas with entities and relationships. Ideal for database modeling and documentation.
User Journey
Map user experiences and interactions across touchpoints. Excellent for UX design and customer journey mapping.
Git Graphs
Visualize Git branching strategies and commit histories. Helpful for explaining version control workflows.
Mindmaps
Organize ideas, brainstorm concepts, and create hierarchical visual structures. Perfect for planning and knowledge mapping.
Pie Charts
Display proportional data distributions with circular charts. Ideal for showing percentages and market share breakdowns.
Timelines
Visualize chronological events and milestones along a time axis. Great for project histories and roadmaps.
Kanban Boards
Organize tasks into columns representing workflow stages. Perfect for agile project management and task tracking.
Quadrant Charts
Plot items on a two-axis grid to compare and prioritize. Ideal for feature prioritization and strategic analysis.
Sankey Diagrams
Visualize flow quantities between nodes with proportional arrows. Perfect for energy flows, budget allocation, and conversion funnels.
XY Charts
Create bar charts and line charts with customizable axes. Ideal for data visualization and trend analysis.
Block Diagrams
Build structured layouts with blocks arranged in columns and rows. Great for system architecture and component overviews.
Architecture Diagrams
Design cloud and system architecture with service icons and connections. Perfect for infrastructure documentation.
Packet Diagrams
Visualize network protocol packet structures with bit-level field layouts. Essential for network protocol documentation.