Mermaid XY Chart Builder
Build Mermaid xychart-beta bar and line charts in your browser. Paste a TSV or CSV table, tweak categories, axes, and series, then copy ready-to-use Mermaid code.
X-axis categories (12)
Series (2)
xychart-beta
    title "Monthly sales revenue"
    x-axis "Month" [Jan, Feb, Mar, Apr, May, Jun, Jul, Aug, Sep, Oct, Nov, Dec]
    y-axis "Revenue (USD)" 4000 --> 12000
    bar [5000, 6000, 7500, 8200, 9500, 10500, 11000, 10200, 9200, 8500, 7000, 6000]
line [5500, 6300, 7900, 8800, 10000, 11200, 11800, 11000, 9900, 9000, 7500, 6500]Example
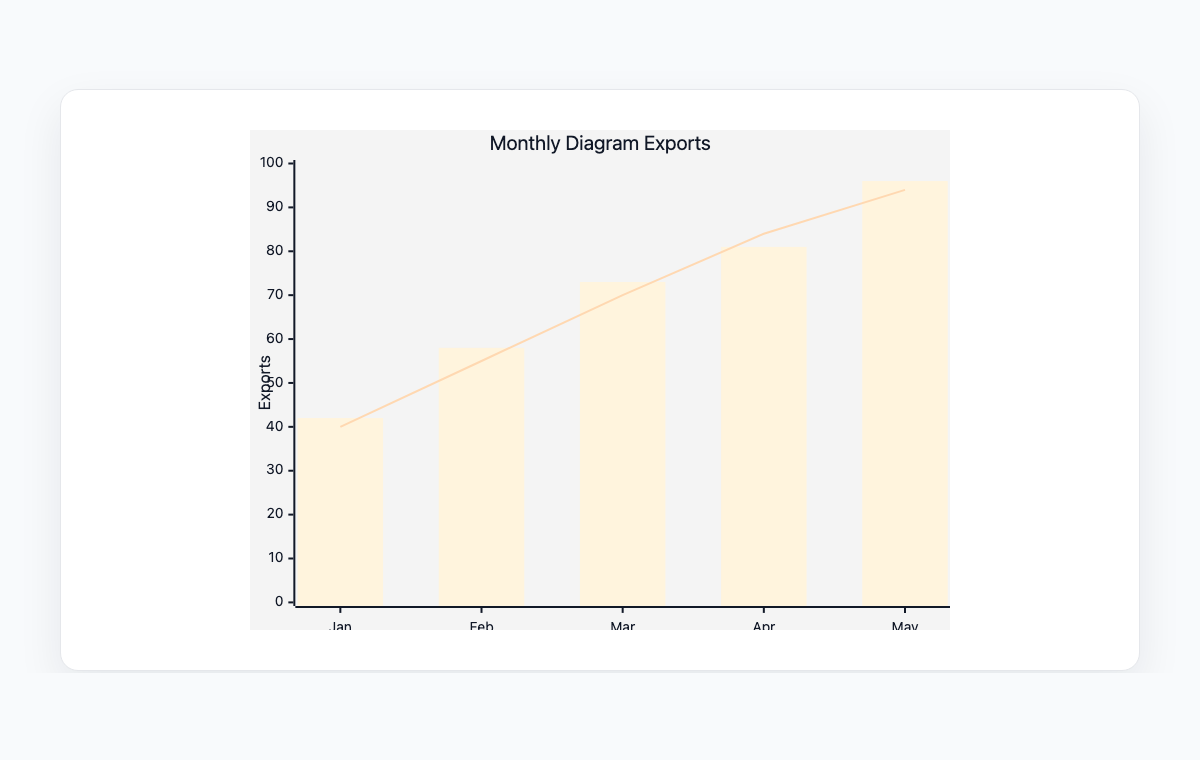
XY chart builder example
A Mermaid XY chart combining bars and a line for monthly diagram exports.
Mermaid code
xychart-beta
    title "Monthly Diagram Exports"
    x-axis [Jan, Feb, Mar, Apr, May]
    y-axis "Exports" 0 --> 100
    bar [42, 58, 73, 81, 96]
    line [40, 55, 70, 84, 94]
How to build a Mermaid xychart-beta chart online
Load an example or paste a TSV / CSV table from your spreadsheet to populate categories and series.
Edit the chart title, x-axis label, and y-axis range; toggle vertical or horizontal orientation.
Add or remove series and switch each one between bar and line independently.
Copy the generated Mermaid xychart-beta code or export the live preview to PNG or SVG.
常见问题
What is xychart-beta in Mermaid?
xychart-beta is the Mermaid syntax for bar and line charts plotted on a Cartesian axis. It supports a title, labelled x and y axes, multiple bar or line series, and an optional horizontal orientation. The 'beta' suffix means the syntax is still maturing but is widely supported by current Mermaid renderers.
Can I mix bar and line series in one chart?
Yes. Each series has an independent kind, so a typical use case is a primary bar series with one or more overlay lines (for example, monthly revenue as bars with a forecast as a line). Add as many series as you need; the renderer will color them automatically.
How do I import data from a spreadsheet?
Open the paste panel and copy a range from Google Sheets, Excel, or any tabular source. The parser detects tabs, commas, and whitespace, treats the first row as headers and the first column as categories by default, and auto-fits the y-axis range to your data.
Can the chart be rendered horizontally?
Yes. Switch the orientation toggle to Horizontal and the builder emits 'xychart-beta horizontal'. Bars then run left to right and the y-axis becomes the value axis at the bottom of the chart.
Is anything uploaded to a server?
No. Parsing, rendering, and export all happen in your browser. Your data never leaves your device.