Mindmaps
Organize ideas, brainstorm concepts, and create hierarchical visual structures. Perfect for planning and knowledge mapping.
What is Mindmaps?
Mindmaps are hierarchical diagrams that visually organize information around a central concept. Starting from a root node, ideas branch out into related topics, subtopics, and details. Mindmaps leverage the brain's natural tendency toward visual and associative thinking, making them powerful tools for brainstorming, note-taking, project planning, and knowledge organization.
Edit and preview
Build a Mindmaps with Mermaid syntax and see changes instantly.
Example
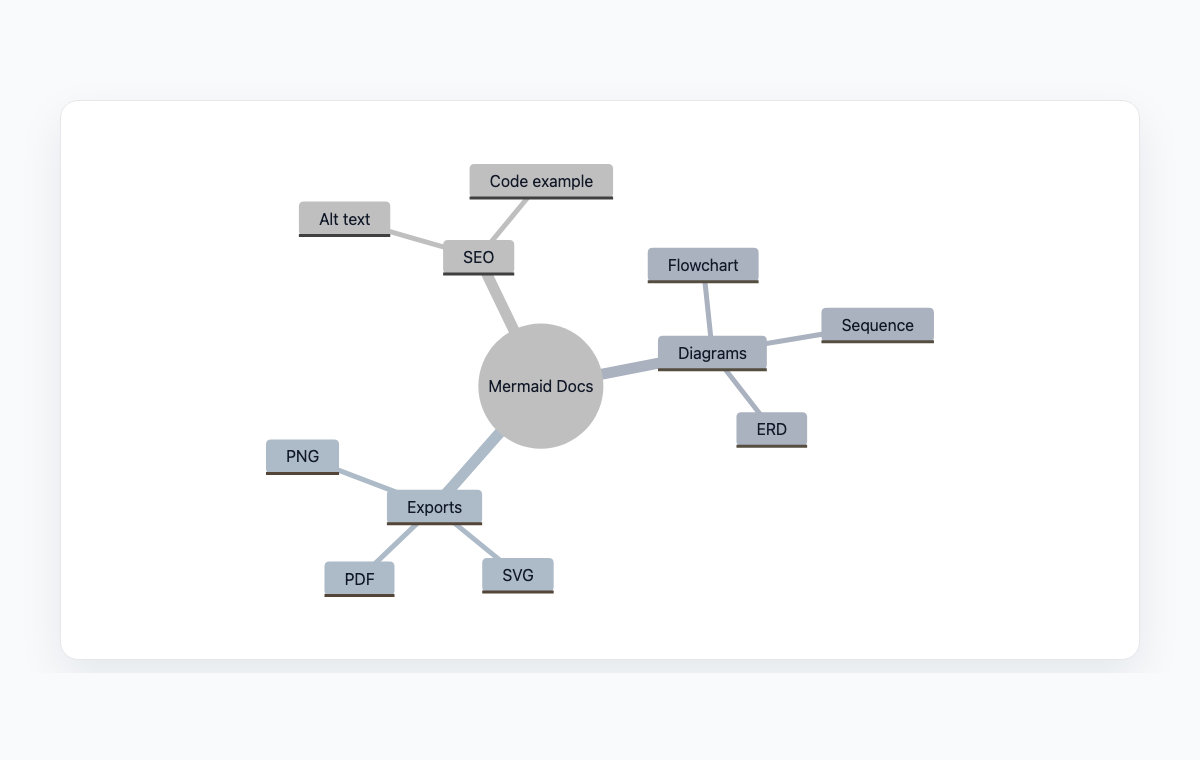
Mindmap example
A Mermaid mindmap organizing diagram types, export formats, and SEO tasks.
Mermaid code
mindmap
  root((Mermaid Docs))
    Diagrams
      Flowchart
      Sequence
      ERD
    Exports
      PNG
      SVG
      PDF
    SEO
      Alt text
      Code example
Common Use Cases
Brainstorming Sessions
Capture ideas during team meetings or solo brainstorming. Start with a central theme and let ideas branch naturally into related concepts.
Project Planning
Break down projects into components, tasks, and deliverables. Visualize the full scope of work in a hierarchical structure.
Knowledge Organization
Structure learning materials, course outlines, or documentation hierarchies. Create visual study guides and reference materials.
Content Strategy
Plan content hierarchies, topic clusters, and information architecture. Map relationships between different content areas.
Key Features
Hierarchical Structure
Create multi-level trees with a central root node branching into topics, subtopics, and leaf nodes.
Node Shapes
Use different shapes like rounded rectangles, circles, bangs, and clouds to differentiate node types and importance.
Automatic Layout
Mermaid automatically arranges nodes with balanced spacing, ensuring readable and visually appealing diagrams.
Text-Based Editing
Define the entire mindmap structure using simple indentation-based syntax that mirrors the hierarchical nature of ideas.
Best Practices
Start with a Clear Center
The root node should clearly state the main topic. Keep it concise and specific to guide all branches.
Limit Branch Depth
Keep the hierarchy to 3-4 levels deep. If branches go deeper, consider splitting into separate mindmaps.
Use Keywords
Label nodes with keywords or short phrases rather than full sentences. This keeps the map scannable and focused.
Group Related Ideas
Organize branches so related concepts are adjacent. This makes the mindmap easier to read and understand.
Explore other diagram types
Flowcharts
Visualize processes, workflows, and algorithms with nodes and directional arrows. Perfect for business processes and decision trees.
Sequence Diagrams
Document interactions between different actors or systems over time. Ideal for API documentation and system design.
Class Diagrams
Model object-oriented systems with classes, attributes, and relationships. Essential for software architecture planning.
State Diagrams
Represent state transitions in systems or applications. Great for modeling lifecycle states and workflows.
Gantt Charts
Plan and track project timelines with tasks and dependencies. Perfect for project management and scheduling.
ER Diagrams
Design database schemas with entities and relationships. Ideal for database modeling and documentation.
User Journey
Map user experiences and interactions across touchpoints. Excellent for UX design and customer journey mapping.
Git Graphs
Visualize Git branching strategies and commit histories. Helpful for explaining version control workflows.
Pie Charts
Display proportional data distributions with circular charts. Ideal for showing percentages and market share breakdowns.
Timelines
Visualize chronological events and milestones along a time axis. Great for project histories and roadmaps.
Kanban Boards
Organize tasks into columns representing workflow stages. Perfect for agile project management and task tracking.
Quadrant Charts
Plot items on a two-axis grid to compare and prioritize. Ideal for feature prioritization and strategic analysis.
Sankey Diagrams
Visualize flow quantities between nodes with proportional arrows. Perfect for energy flows, budget allocation, and conversion funnels.
XY Charts
Create bar charts and line charts with customizable axes. Ideal for data visualization and trend analysis.
Block Diagrams
Build structured layouts with blocks arranged in columns and rows. Great for system architecture and component overviews.
Architecture Diagrams
Design cloud and system architecture with service icons and connections. Perfect for infrastructure documentation.
Packet Diagrams
Visualize network protocol packet structures with bit-level field layouts. Essential for network protocol documentation.