Block Diagrams
Build structured layouts with blocks arranged in columns and rows. Great for system architecture and component overviews.
What is Block Diagrams?
Block diagrams represent systems or processes using labeled blocks arranged in structured layouts. They show the high-level organization of components and their relationships without getting into detailed implementation specifics. Block diagrams are widely used in engineering, systems design, and architecture documentation to provide clear, accessible overviews of complex systems.
Edit and preview
Build a Block Diagrams with Mermaid syntax and see changes instantly.
Example
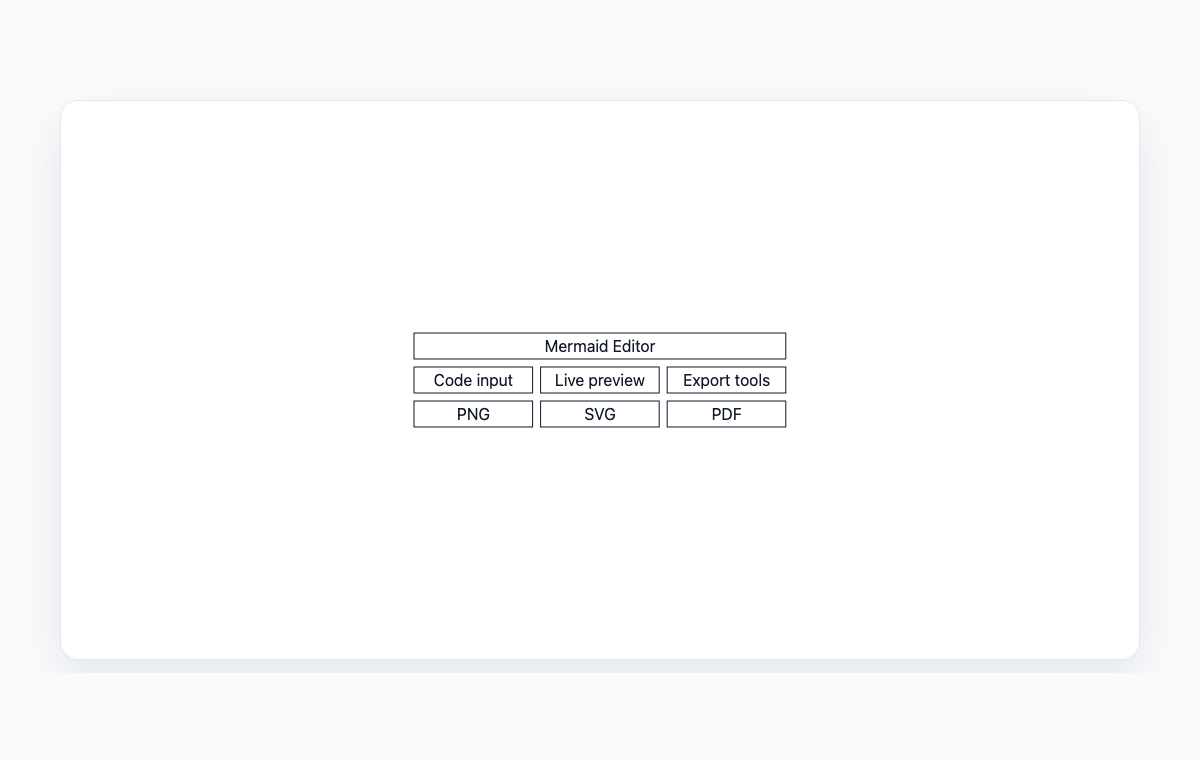
Block diagram example
A Mermaid block diagram showing editor input, preview, and export tool areas.
Mermaid code
block-beta
columns 3
  Editor["Mermaid Editor"]:3
  Code["Code input"] Preview["Live preview"] Export["Export tools"]
  PNG["PNG"] SVG["SVG"] PDF["PDF"]
Common Use Cases
System Architecture
Design high-level system architectures showing major components and their relationships. Communicate system design to technical and non-technical stakeholders.
Component Overviews
Show how software or hardware components are organized. Visualize layers, modules, and their interactions.
Network Topology
Illustrate network layouts with servers, switches, and connections. Document infrastructure components and their arrangement.
Process Overview
Present high-level process flows with major stages as blocks. Provide a simplified view of complex processes.
Key Features
Column-Based Layout
Arrange blocks in a grid with configurable column counts. Control the visual structure of your diagram precisely.
Block Spanning
Make blocks span multiple columns for emphasis or to represent components that encompass multiple sub-components.
Nested Groups
Create blocks within blocks to show containment relationships and hierarchical structures.
Multiple Shapes
Use different shapes like rectangles, rounded boxes, stadiums, and cylinders to represent different component types.
Best Practices
Keep It High-Level
Block diagrams should show the big picture. Avoid including too much detail—use other diagram types for specifics.
Use Consistent Sizing
Keep blocks at similar sizes unless size differences convey meaning about importance or scale.
Label Clearly
Use descriptive names for each block. The diagram should be understandable without additional documentation.
Arrange Logically
Place related blocks near each other. Use top-to-bottom or left-to-right flow to show data or control flow direction.
Explore other diagram types
Flowcharts
Visualize processes, workflows, and algorithms with nodes and directional arrows. Perfect for business processes and decision trees.
Sequence Diagrams
Document interactions between different actors or systems over time. Ideal for API documentation and system design.
Class Diagrams
Model object-oriented systems with classes, attributes, and relationships. Essential for software architecture planning.
State Diagrams
Represent state transitions in systems or applications. Great for modeling lifecycle states and workflows.
Gantt Charts
Plan and track project timelines with tasks and dependencies. Perfect for project management and scheduling.
ER Diagrams
Design database schemas with entities and relationships. Ideal for database modeling and documentation.
User Journey
Map user experiences and interactions across touchpoints. Excellent for UX design and customer journey mapping.
Git Graphs
Visualize Git branching strategies and commit histories. Helpful for explaining version control workflows.
Mindmaps
Organize ideas, brainstorm concepts, and create hierarchical visual structures. Perfect for planning and knowledge mapping.
Pie Charts
Display proportional data distributions with circular charts. Ideal for showing percentages and market share breakdowns.
Timelines
Visualize chronological events and milestones along a time axis. Great for project histories and roadmaps.
Kanban Boards
Organize tasks into columns representing workflow stages. Perfect for agile project management and task tracking.
Quadrant Charts
Plot items on a two-axis grid to compare and prioritize. Ideal for feature prioritization and strategic analysis.
Sankey Diagrams
Visualize flow quantities between nodes with proportional arrows. Perfect for energy flows, budget allocation, and conversion funnels.
XY Charts
Create bar charts and line charts with customizable axes. Ideal for data visualization and trend analysis.
Architecture Diagrams
Design cloud and system architecture with service icons and connections. Perfect for infrastructure documentation.
Packet Diagrams
Visualize network protocol packet structures with bit-level field layouts. Essential for network protocol documentation.