Online Gantt Chart Maker
Build professional Gantt charts in your browser. Define tasks, group them into sections, chain dependencies, and watch the Mermaid gantt code update live. Export as PNG, SVG, or PDF for slides and reports.
Tasks (0)
Add tasks with start dates and durations to see the Mermaid gantt code here.
Preview will appear once at least one task has a start date and duration.
Notes
- Add at least one task to render the Gantt chart.
Example
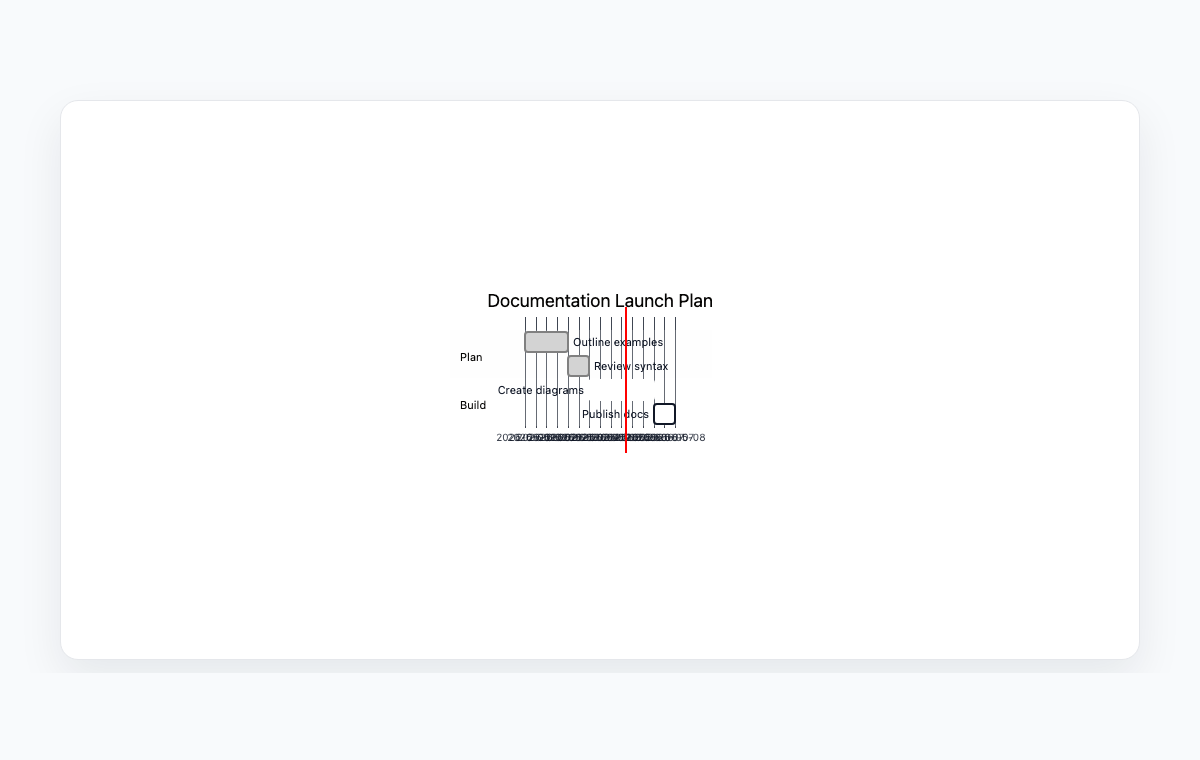
Online Gantt chart example
A Mermaid Gantt chart for planning documentation work with dependent tasks.
Mermaid code
gantt
    title Documentation Launch Plan
    dateFormat  YYYY-MM-DD
    section Plan
    Outline examples      :done, p1, 2026-05-01, 2d
    Review syntax         :done, p2, after p1, 1d
    section Build
    Create diagrams       :active, b1, 2026-05-04, 3d
    Publish docs          :b2, after b1, 1d
How to make a Gantt chart with Mermaid
Set the project title and pick a date format. Toggle Hide weekends if your team works Monday to Friday only.
Add tasks one by one. Group related tasks under the same section name (e.g. Discovery, Build, Ship) — sections appear as horizontal bands in the chart.
For each task, choose a start: a fixed date, or after another task to chain dependencies. Set the duration in days, weeks, or hours.
Copy the generated Mermaid gantt code into your docs, or open the live preview and export the chart as PNG, SVG, or PDF.
Frequently Asked Questions
What is a Mermaid Gantt chart?
Mermaid's gantt syntax describes a project timeline as a list of tasks with dates, durations, and optional dependencies. Mermaid renders it as a stacked bar chart with one row per task, grouped under section headers. It is widely supported in GitHub, GitLab, Notion, Obsidian, and most modern docs platforms.
How do task dependencies work?
Set a task's start to After task and pick the upstream task from the dropdown. Mermaid renders the dependent task immediately after the upstream finishes, and the chart auto-shifts when you change the upstream's duration — no manual date juggling.
Can I show the project status (done / active / critical)?
Yes. Each task has a Status field. Pick Done for completed work, Active for in-progress, or Critical to highlight the critical path. Mermaid renders each status with a distinct color so the status of the whole project is visible at a glance.
Does the chart skip weekends?
Yes if you toggle Hide weekends in the project metadata bar. Mermaid then emits 'excludes weekends', the renderer skips Saturdays and Sundays in the bars, and the computed end dates in the editor also skip weekends so the numbers match what you see.
Is anything uploaded to a server?
No. Parsing, date math, rendering, and export all happen in your browser. Your project plan never leaves your device.