Timelines
Visualize chronological events and milestones along a time axis. Great for project histories and roadmaps.
What is Timelines?
Timeline diagrams present events in chronological order along a time axis, making it easy to see the sequence and relationships between events. They are essential for project planning, historical documentation, product roadmaps, and any scenario where understanding temporal relationships is important. Timelines provide a clear, linear narrative of events over time.
Edit and preview
Build a Timelines with Mermaid syntax and see changes instantly.
Example
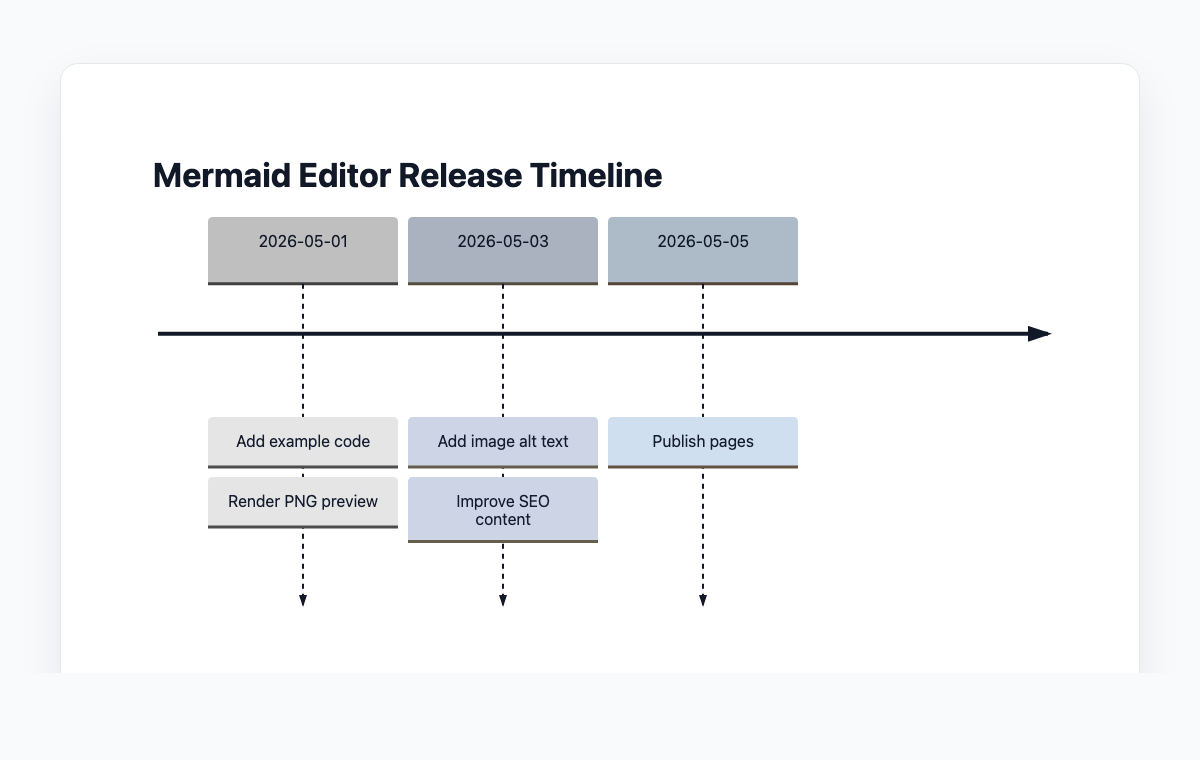
Timeline example
A Mermaid timeline showing when example code, PNG previews, and alt text are added.
Mermaid code
timeline
    title Mermaid Editor Release Timeline
    2026-05-01 : Add example code
               : Render PNG preview
    2026-05-03 : Add image alt text
               : Improve SEO content
    2026-05-05 : Publish pages
Common Use Cases
Product Roadmaps
Visualize planned features, releases, and milestones along a timeline. Communicate development priorities to stakeholders and team members.
Project Milestones
Track key project events, deliverables, and deadlines. Provide a clear overview of project progress and upcoming milestones.
Historical Documentation
Present company history, technology evolution, or any chronological story. Create engaging visual narratives of events over time.
Release Notes
Document software versions and their key features in chronological order. Help users understand the evolution of a product.
Key Features
Time Periods
Define time periods with labels like dates, quarters, or custom text to organize events chronologically.
Multiple Events per Period
Group multiple events under the same time period to show concurrent activities or related items.
Titles and Sections
Add overall titles and section headers to provide context and organize the timeline into logical groups.
Auto-Layout
Mermaid automatically spaces and arranges events along the timeline for optimal readability.
Best Practices
Use Consistent Time Scales
Keep time intervals consistent throughout the timeline. Don't mix days with years unless clearly indicated.
Highlight Key Events
Emphasize the most important milestones. Not every event needs equal visual weight.
Keep Labels Concise
Use short, descriptive labels for events. Details can be provided in accompanying documentation.
Group Related Events
Use sections to group related events together, making it easier to understand themes and phases.
Explore other diagram types
Flowcharts
Visualize processes, workflows, and algorithms with nodes and directional arrows. Perfect for business processes and decision trees.
Sequence Diagrams
Document interactions between different actors or systems over time. Ideal for API documentation and system design.
Class Diagrams
Model object-oriented systems with classes, attributes, and relationships. Essential for software architecture planning.
State Diagrams
Represent state transitions in systems or applications. Great for modeling lifecycle states and workflows.
Gantt Charts
Plan and track project timelines with tasks and dependencies. Perfect for project management and scheduling.
ER Diagrams
Design database schemas with entities and relationships. Ideal for database modeling and documentation.
User Journey
Map user experiences and interactions across touchpoints. Excellent for UX design and customer journey mapping.
Git Graphs
Visualize Git branching strategies and commit histories. Helpful for explaining version control workflows.
Mindmaps
Organize ideas, brainstorm concepts, and create hierarchical visual structures. Perfect for planning and knowledge mapping.
Pie Charts
Display proportional data distributions with circular charts. Ideal for showing percentages and market share breakdowns.
Kanban Boards
Organize tasks into columns representing workflow stages. Perfect for agile project management and task tracking.
Quadrant Charts
Plot items on a two-axis grid to compare and prioritize. Ideal for feature prioritization and strategic analysis.
Sankey Diagrams
Visualize flow quantities between nodes with proportional arrows. Perfect for energy flows, budget allocation, and conversion funnels.
XY Charts
Create bar charts and line charts with customizable axes. Ideal for data visualization and trend analysis.
Block Diagrams
Build structured layouts with blocks arranged in columns and rows. Great for system architecture and component overviews.
Architecture Diagrams
Design cloud and system architecture with service icons and connections. Perfect for infrastructure documentation.
Packet Diagrams
Visualize network protocol packet structures with bit-level field layouts. Essential for network protocol documentation.