Architecture Diagrams
Design cloud and system architecture with service icons and connections. Perfect for infrastructure documentation.
What is Architecture Diagrams?
Architecture diagrams visualize the structure of software systems, cloud infrastructure, and technical environments. They show services, databases, networks, and their interconnections using standard icons and notation. Architecture diagrams are essential for system design, cloud deployment planning, infrastructure documentation, and communicating technical decisions to engineering teams.
Edit and preview
Build a Architecture Diagrams with Mermaid syntax and see changes instantly.
Example
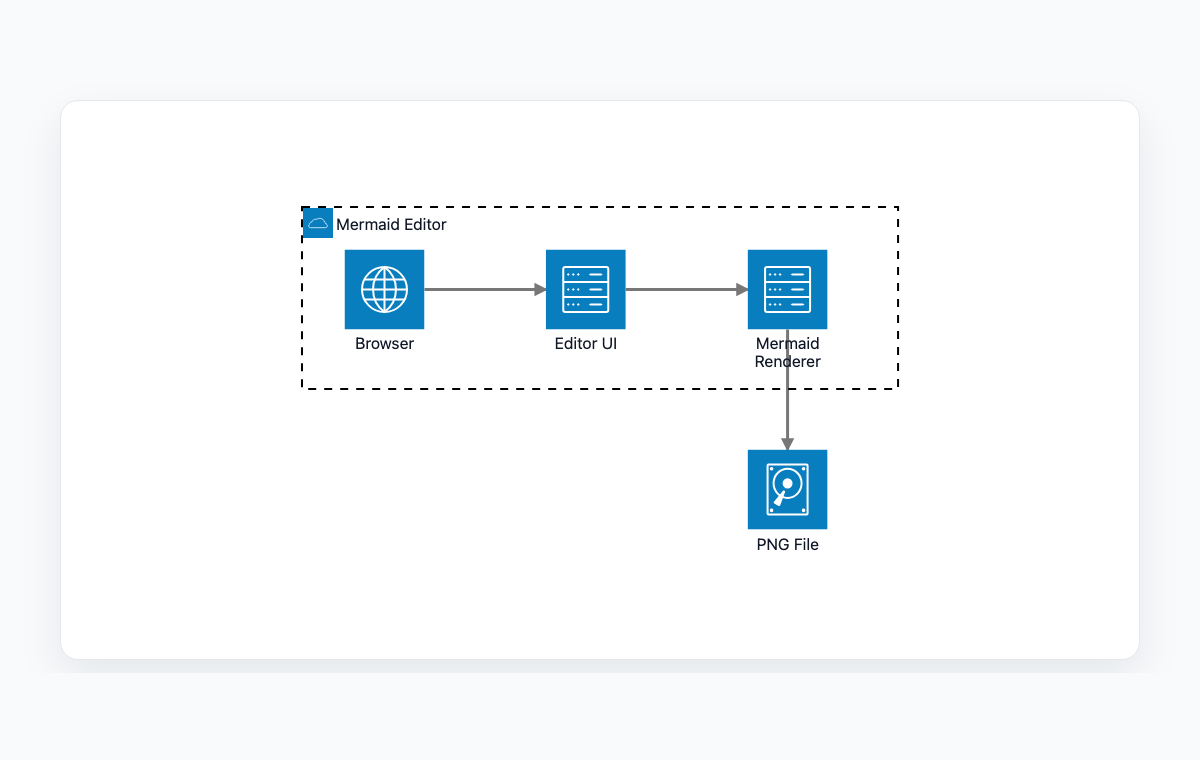
Architecture diagram example
A Mermaid architecture diagram for a browser editor, renderer, and exported PNG file.
Mermaid code
architecture-beta
    group app(cloud)[Mermaid Editor]

    service browser(internet)[Browser] in app
    service editor(server)[Editor UI] in app
    service renderer(server)[Mermaid Renderer] in app
    service file(disk)[PNG File]

    browser:R --> L:editor
    editor:R --> L:renderer
    renderer:B --> T:file
Common Use Cases
Cloud Infrastructure Design
Plan AWS, Azure, or GCP deployments. Visualize services, networking, storage, and compute resources before provisioning.
Microservices Architecture
Map service boundaries, API gateways, message queues, and data stores. Document how microservices communicate and depend on each other.
System Documentation
Create living documentation of production systems. Help new team members understand infrastructure and service topology.
Security Architecture
Visualize security boundaries, authentication flows, and network segmentation. Document security controls and their placement.
Key Features
Service Icons
Use standard icons for common services like databases, servers, cloud services, and network components.
Service Groups
Group related services into named groups to show logical boundaries, VPCs, or organizational units.
Connection Types
Show directional connections between services with labels to describe the communication protocol or data flow.
Layered Layout
Arrange services in layers (presentation, business logic, data) to show architectural tiers clearly.
Best Practices
Show the Right Level of Detail
Match the detail level to your audience. Executives need overview diagrams; engineers need specific service details.
Use Standard Icons
Use recognized icons for services and infrastructure. This makes diagrams immediately understandable to technical audiences.
Group Related Services
Use visual grouping to show service boundaries, network zones, or deployment environments.
Keep It Current
Architecture diagrams lose value when they diverge from reality. Update them as part of your deployment process.
Explore other diagram types
Flowcharts
Visualize processes, workflows, and algorithms with nodes and directional arrows. Perfect for business processes and decision trees.
Sequence Diagrams
Document interactions between different actors or systems over time. Ideal for API documentation and system design.
Class Diagrams
Model object-oriented systems with classes, attributes, and relationships. Essential for software architecture planning.
State Diagrams
Represent state transitions in systems or applications. Great for modeling lifecycle states and workflows.
Gantt Charts
Plan and track project timelines with tasks and dependencies. Perfect for project management and scheduling.
ER Diagrams
Design database schemas with entities and relationships. Ideal for database modeling and documentation.
User Journey
Map user experiences and interactions across touchpoints. Excellent for UX design and customer journey mapping.
Git Graphs
Visualize Git branching strategies and commit histories. Helpful for explaining version control workflows.
Mindmaps
Organize ideas, brainstorm concepts, and create hierarchical visual structures. Perfect for planning and knowledge mapping.
Pie Charts
Display proportional data distributions with circular charts. Ideal for showing percentages and market share breakdowns.
Timelines
Visualize chronological events and milestones along a time axis. Great for project histories and roadmaps.
Kanban Boards
Organize tasks into columns representing workflow stages. Perfect for agile project management and task tracking.
Quadrant Charts
Plot items on a two-axis grid to compare and prioritize. Ideal for feature prioritization and strategic analysis.
Sankey Diagrams
Visualize flow quantities between nodes with proportional arrows. Perfect for energy flows, budget allocation, and conversion funnels.
XY Charts
Create bar charts and line charts with customizable axes. Ideal for data visualization and trend analysis.
Block Diagrams
Build structured layouts with blocks arranged in columns and rows. Great for system architecture and component overviews.
Packet Diagrams
Visualize network protocol packet structures with bit-level field layouts. Essential for network protocol documentation.